
Introduction
A lot of CPU-heavy operations are faster on the 64-bit OS and after trying to run a Home IDS on a Raspberry Pi3 with 2 Go of Ram, which was too slow to be something else than a POC, I was able to give a successful try using a Raspberry Pi4 8G Arm 64-bit OS to build a low-cost Home network Intrusion Detection system to secure and get an alert if any suspicious activity was detected in your home network.
It is a single board computer that is powered by an ARM Cortex-A72 processor and has 8GB of RAM, with built-in Wi-Fi and Bluetooth connectivity, making it an ideal choice for home security and intrusion detection systems (IDS).
The Raspberry Pi4 8G Arm64 can also be used to run multiple Docker container platform, which allows users to quickly and easily deploy applications and services in a secure and isolated environment.
Table of Content
- Required Materials
- Installation overview
- Setting up your Raspberry Pi 64bit
- Use Raspberry PI imager to install the raspberry PI os lite (64bit)
- Update you operating system and firmware
- Configure the USB drive key
- Install Suricata on your Raspberry PI4
- Install pre-requisites
- Download and Install Suricata
- Configure Suricata
- Using Suricata as a service
- Move the Suricata log to the usb key
- Install Docker
- Install the docker container for Elasticsearch
- Run ElasticSearch in a docker container
- Optimize Elasticsearch for your Raspberry Pi4 8 GB ram
- Install the docker container for Kibana
- Run Kibana in a docker container
- Configure Kibana
- Add the Suricata extension to Kibana
- Install elastic agent on your Raspberry
- Install elastic agent
- Configure Elastic-agent
- Test your HOME IDS
- Configure port mirroring on your switch
- Conclusion
Required Materials
Raspberry Pi 4 8 GB memory (should cost $75 at official resellers, but with the worldwide penury, the price can go up to $200 on Amazon)
- A 15W USB-C power supply (the official Raspberry Pi USB-C Power Supply)
- A Micro SD card
- A fast usb3 key of 64 GB
- A switch configured to mirror traffic
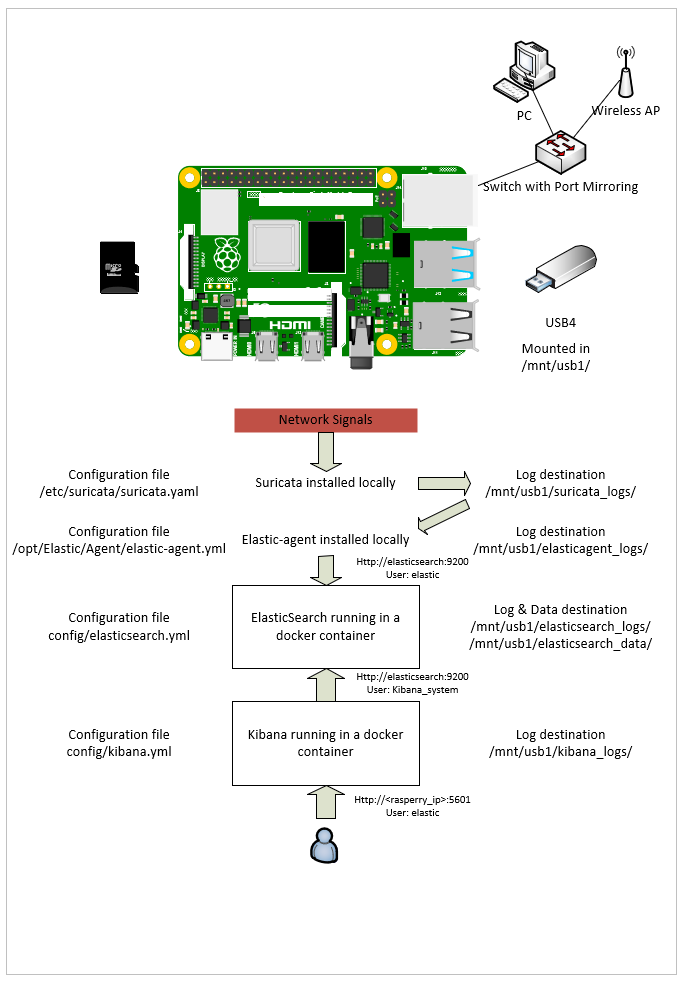
Installation overview
Setting up your Raspberry Pi 64bit
Before beginning, it is important to ensure that the Raspberry Pi4 8G Arm64 is properly set up and configured. This includes connecting the device to a power source and setting up the operating system.
Raspberry Pi Imager is a software tool that allows you to easily and quickly install an operating system on your Raspberry Pi. It is provided by the Raspberry Pi Foundation and is the recommended way to install an operating system on a Raspberry Pi. The software is available for Windows, macOS, and Ubuntu.
With Raspberry Pi Imager, you can choose from a list of operating systems and download the latest version directly to your computer. You can then use the software to write the image to an SD card, which you can then insert into your Raspberry Pi to boot the operating system.
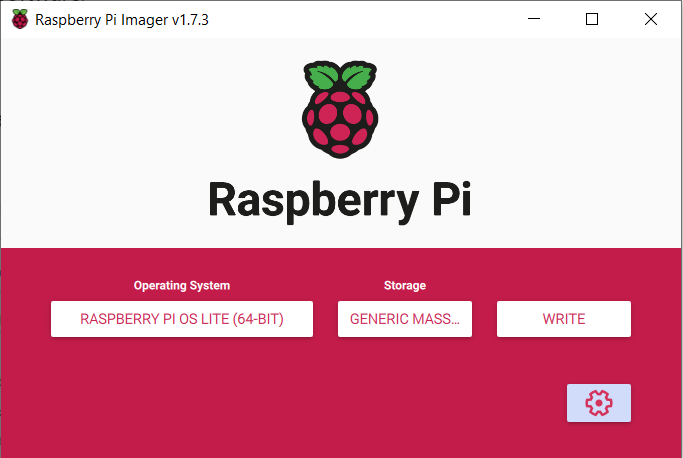
Use Raspberry PI imager to install the raspberry PI os lite (64bit)
Download here : https://www.raspberrypi.com/software/
Choose the raspberry PI OS lite (64bit) in additional Operating System
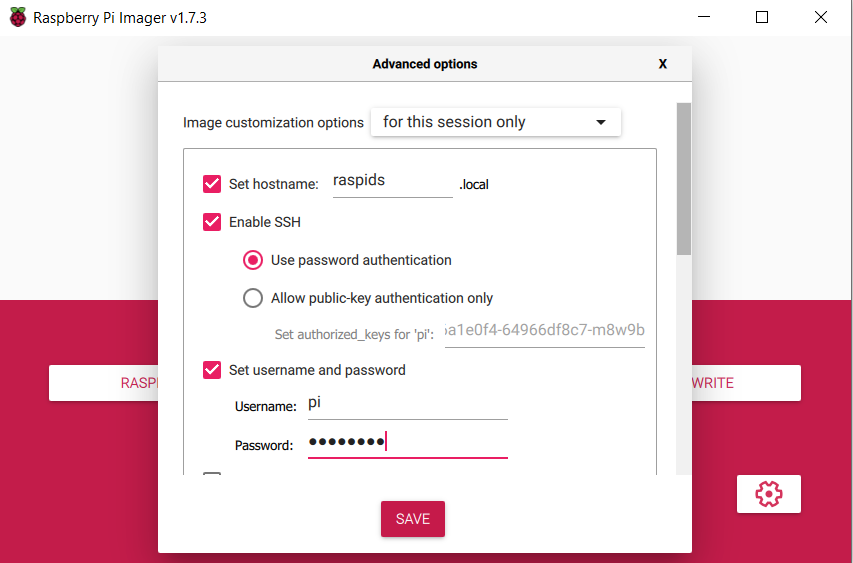
Click on the gear and configure your chosen hostname and a username/password for ssh access and write your SD card
Update you operating system and firmware
ssh to you raspberry PI address with the username/ password
(you can ping scan using ex; nmap -sP )192.168.1.0/24)
ssh pi@<ipaddress>Check that you right choose the 64bit OS version
uname -aLinux raspids 5.15.61-v8+ #1579 SMP PREEMPT Fri Aug 26 11:16:44 BST 2022 aarch64 GNU/Linuxsudo apt-get update && sudo apt-get upgrade -yCheck again you OS version
uname -a Update the firmware
sudo rpi-updateLaunch the raspi configuration utility :
sudo raspi-config
Select 6. Advanced Options > A1 Expand Filesystem > Ok
Select 4 Performance Options> P2 GPU Memory > enter 16 for the value
Exit and reboot by clicking “yes on reboot now”
Reconnect to your raspberry using ssh
Configure the USB drive key
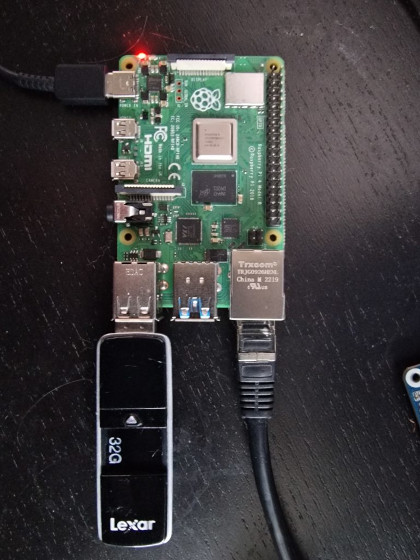
Insert a fast USB key into an USB3 port (the blue ones)
Remove existing partition (it will erase the disk!)
sudo wipefs –all –force /dev/sda1
Create a XFS partition to benefit from more speed on your usb key :
sudo apt-get install xfsprogs -y
sudo mkfs.xfs -f /dev/sda1
Verify your disk
sudo blkid You should see this, the last line is your XFS disk :
/dev/mmcblk0p1: LABEL_FATBOOT="boot" LABEL="boot" UUID="0F92-BECC" BLOCK_SIZE="512" TYPE="vfat" PARTUUID="0cfcfda1-01"
/dev/mmcblk0p2: LABEL="rootfs" UUID="41c98998-6a08-4389-bf74-79c9efcf0739" BLOCK_SIZE="4096" TYPE="ext4" PARTUUID="0cfcfda1-02"
/dev/sda1: UUID="2e663bc2-96ab-4330-b533-db07269d1afc" BLOCK_SIZE="512" TYPE="xfs" PARTUUID="21e60f8c-01"
Create a directory to mount the USB key :
sudo mkdir /mnt/usb1Test if the mount is successful :
sudo mount /dev/sda1 /mnt/usb1/Make sure the device is automatically mounted at boot time, run
sudo nano /etc/fstabAdd a new line at the end
/dev/sda1 /mnt/usb1 xfs defaults 0 0NB: replace pi with your ssh username
Ctrl + x and press Y and enter to save the file
Unmount the usb disk and try the automount:
sudo umount /dev/sda1

sudo mount -a
Create required directory on usb disk :
sudo mkdir /mnt/usb1/suricata_logs

sudo mkdir /mnt/usb1/es01_logs

sudo mkdir /mnt/usb1/es01_data

sudo mkdir /mnt/usb1/kib01_logs

sudo mkdir /mnt/usb1/kib01_data

sudo mkdir /mnt/usb1/elastic_agent
Change the owner to PI
sudo chown -R pi /mnt/usb1/*Install Suricata on your Raspberry PI4
Suricata is an open-source, high performance Intrusion Detection and Prevention System (IDS/IPS) that is used to detect malicious network activity and cyber threats. It is a signature-based system that uses rules to detect known threats, as well as behavior-based analysis to identify new and unknown threats.
Install pre-requisites
sudo apt install libyaml-dev libpcre3-dev libjansson-dev libpcap-dev libnspr4-dev libcap-ng-dev libnss3-dev libmagic-dev liblz4-dev rustc cargo libmaxminddb-dev python3-pip
sudo pip install pyyaml
Download and Install Suricata :
wget https://www.openinfosecfoundation.org/download/suricata-6.0.9.tar.gz
tar xzf suricata-6.0.9.tar.gz
cd suricata-6.0.9
./configure --prefix=/usr --sysconfdir=/etc --localstatedir=/var --enable-geoipmake

sudo make install-full
Build suricata-update utility:
cd suricata-update/
sudo python setup.py build
sudo python setup.py install
Return to Home and run suricata-update to add and update the rules
sudo suricata-update update-sources

sudo suricata-update

sudo suricata-update enable-source et/open
sudo suricata-update enable-source oisf/trafficid
sudo suricata-update enable-source sslbl/ssl-fp-blacklist
sudo suricata-update enable-source sslbl/ja3-fingerprints
sudo suricata-update enable-source etnetera/aggressive
sudo suricata-update enable-source stamus/lateral
sudo suricata-update enable-source malsilo/win-malware
sudo suricata-update enable-source tgreen/hunting
sudo suricata-update
Configure Suricata
Edit the Suricata config file to indicate what is the IP block of your home addresses: change HOME_NET in /etc/suricata/suricata.yaml to whatever is relevant to your network (in my case it’s 192.168.1.0/24).
sudo nano /etc/suricata/suricata.yaml
    ## Step 1: Inform Suricata about your network
    ##

    vars:
      # more specific is better for alert accuracy and performance
      address-groups:
        HOME_NET: "[192.168.1.0/24]"
        #HOME_NET: "[192.168.0.0/16]"
        #HOME_NET: "[10.0.0.0/8]"
        #HOME_NET: "[172.16.0.0/12]"
        #HOME_NET: "any"

        EXTERNAL_NET: "!$HOME_NET"
        #EXTERNAL_NET: "any"

    ...

    ##
    ## Step 2: Select outputs to enable
    ##

    # The default logging directory.  Any log or output file will be
    # placed here if it's not specified with a full path name. This can be
    # overridden with the -l command line parameter.
    # default-log-dir: /var/log/suricata

    ...

    # Ring size will be computed with respect to "max-pending-packets" and number
    # of threads. You can set manually the ring size in number of packets by setting
    # the following value. If you are using flow "cluster-type" and have really network
    # intensive single-flow you may want to set the "ring-size" independently of the number
    # of threads:
    ring-size: 10000
Using Suricata as a service
To be able to use Suricata as a service, the file “/etc/systemd/system/suricata.service” must be created:
sudo nano /etc/systemd/system/suricata.servicePaste the following code :
# Sample Suricata systemd unit file.

[Unit]

Description=Suricata Intrusion Detection Service

After=network.target syslog.target

[Service]

ExecStart=/usr/bin/suricata -c /etc/suricata/suricata.yaml -i eth0 -S /var/lib/suricata/rules/suricata.rules

ExecReload=/bin/kill -HUP $MAINPID

ExecStop=/bin/kill $MAINPID

[Install]

WantedBy=multi-user.target
Start Suricata and check its status:
sudo systemctl start suricata.service
sudo systemctl status suricata.service
Test Suricata alert triggering :
curl 3wzn5p2yiumh7akj.onion
tail -n 100 /var/log/suricata/fast.log
You should see something like that :
01/26/2023-14:08:23.320703  [**] [1:2014939:5] ET POLICY DNS Query for TOR Hidden Domain .onion Accessible Via TOR [**] [Classification: Potential Corporate Privacy Violation] [Priority: 1] {UDP} 192.168.1.100:43549 -> 8.8.8.8:53
…
Move the Suricata log to the usb key
Move the log location for Suricata to the USB disk by editing and configure the default-log-dir parameter in suricata.yml :
sudo nano /etc/suricata/suricata.yaml
##
## Step 2: Select outputs to enable
##

# The default logging directory.  Any log or output file will be
# placed here if it's not specified with a full path name. This can be
# overridden with the -l command line parameter.

default-log-dir: /mnt/usb1/suricata_logs/
Restart Suricata
sudo systemctl start suricata.serviceCheck that the Suricata log files are created in the new location.
ls /mnt/usb1/suricata_logs/You should see : eve.json fast.log stats.log suricata.log
Install Docker
Docker is a platform for building, shipping, and running applications in containers. Containers are a form of lightweight, portable, and self-contained virtualization that allow developers to package an application and its dependencies together into a single unit.
Use this command to install Docker on your Raspberry
curl -fsSL https://get.docker.com -o get-docker.sh

sudo sh get-docker.sh
Add your user account to docker
sudo usermod -aG docker $USERCreate the docker network:
sudo docker network create elasticInstall the docker container for Elasticsearch
Elasticsearch is a powerful, open-source, full-text search and analytics engine designed for handling large amounts of data. It is based on the Apache Lucene library and enables users to search, analyze, and visualize data in real-time.
Elasticsearch can be used to index, search, and analyze a wide variety of data formats including structured, semi-structured, and unstructured data. It is known for its scalability, reliability, and near real-time search capabilities, making it a popular choice for a wide range of applications, including logging and monitoring, business intelligence, and e-commerce.
Run ElasticSearch in a docker container
docker run -d --restart unless-stopped --name elasticsearch --net elastic -p 9200:9200 -p 9300:9300 -v /mnt/usb1/es01_data:/usr/share/elasticsearch/data -v /mnt/usb1/es01_logs:/usr/share/elasticsearch/logs -e "discovery.type=single-node" -e "xpack.security.enabled=true" arm64v8/elasticsearch:8.6.0 &
Check if you get some error (need to wait a little for full start)
sudo docker logs elasticsearchCheck that geoIP database have been downloaded successfully
"log.level": "INFO", "message":"successfully loaded geoip database file [GeoLite2-ASN.mmdb]"…Log to your elasticsearch container
sudo docker exec -it --user root elasticsearch bashUpdate the container
apt update
apt upgrade
Reset the elastic and kibana_system user password :
bin/elasticsearch-reset-password -u elastic -i
bin/elasticsearch-reset-password -u kibana_system -i
Note the value for your password you will use it to connect kibana to elasticsearch in kibana.yml
Optimize Elasticsearch for your Raspberry Pi4 8 gb ram
Enter the elasticsearch container
sudo docker exec -it --user root elasticsearch bashEdit the jvm parameters in the configuration file config/jvm.options. Set the memory requirements for the Elasticsearch instance.
No more than 1/3 of the available RAM available on the container. Use this command to configure the option in config/jvm.options
total=$(free -m | grep '^Mem:' | awk '{print $2}')
if (( $total < 96000 ))
then
elastic=$(( $total/3))m
else
elastic=32000m
fi
sed -i "s/^-Xms.*/-Xms$elastic/g" config/jvm.options
sed -i "s/^-Xmx.*/-Xmx$elastic/g" config/jvm.options
Verify that you have the two parameters Xms et Xmx with some value :
cat config/elasticsearch.yml################################################################
## IMPORTANT: JVM heap size
################################################################
##
## The heap size is automatically configured by Elasticsearch
## based on the available memory in your system and the roles
## each node is configured to fulfill. If specifying heap is
## required, it should be done through a file in jvm.options.d,
## which should be named with .options suffix, and the min and
## max should be set to the same value. For example, to set the
## heap to 4 GB, create a new file in the jvm.options.d
## directory containing these lines:
##
-Xms2604m
-Xmx2604m
##
## See https://www.elastic.co/guide/en/elasticsearch/reference/8.6/heap-size.html
## for more information
##
################################################################Optimize limits
sed -i '/^elasticsearch/d' /etc/security/limits.conf
cat >> /etc/security/limits.conf << EOF
elasticsearchhardnproc 4096
elasticsearchsoftnproc 4096
elasticsearch-nofile65535
EOF
Exit and restart elasticsearch container
docker restart elasticsearchInstall the docker container for Kibana
Kibana is a powerful open-source data visualization and exploration platform that is tightly integrated with Elasticsearch. It is used to visualize, analyze, and search large volumes of data stored in Elasticsearch indices.
Kibana provides a graphical user interface that allows users to create and save custom visualizations, including bar charts, line graphs, pie charts, and more. It also includes powerful search and filtering capabilities that allow users to quickly find and analyze specific data sets.
Run Kibana in a docker container
docker run -d --restart unless-stopped --name kibana --net elastic -p 5601:5601 -v /mnt/usb1/kib01_data:/usr/share/kibana/data -v /mnt/usb1/kib01_logs:/var/log -e "ELASTICSEARCH_HOSTS=http://elasticsearch:9200" -e "ES_HOST=elasticsearch" -e "xpack.security.enabled=false" arm64v8/kibana:8.6.0 & Check if you get some error (need to wait a little for full start)
sudo docker logs kibana
Wait to see this :
[INFO ][status] Kibana is now available (was degraded)Enter the Kibana container and install nano
sudo docker exec -it --user root kibana bash
apt update
apt upgrade
apt install nano
Configure Kibana
Generate encryption key to copy to kibana.yml:
bin/kibana-encryption-keys generateCopy the three line of code and edit kibana.yml
nano config/kibana.ymlYou will need to :
- Paste the three lines values returned from kibana-encryption-keys
- Enter your elastic username and password
- Disable monitoring to free some resources
- Disable fleet agent
You configuration should look like that :
#
# ** THIS IS AN AUTO-GENERATED FILE **
#
# Default Kibana configuration for docker target
server.host: "0.0.0.0"
server.shutdownTimeout: "5s"
elasticsearch.hosts: [ "http://elasticsearch:9200" ]
monitoring.ui.container.elasticsearch.enabled: true

# values returned from kibana-encryption-keys
xpack.encryptedSavedObjects.encryptionKey: <valuefromkibana-encryption-keys>
xpack.reporting.encryptionKey: <valuefromkibana-encryption-keys>
xpack.security.encryptionKey: <valuefromkibana-encryption-keys>

# your elastic username and password
elasticsearch.username: "kibana_system"
elasticsearch.password: "<yourpassword>"

# Disable monitoring to free some resources
monitoring.ui.enabled: false
monitoring.kibana.collection.enabled: false

# Disable fleet agent to free some resources
xpack.fleet.agents.enabled: false
Exit the container :
exitRestart kibana and look the log for errors: (need to wait a little for full start, it can take time)
sudo docker restart kibana
sudo docker logs kibana
Wait to see this :
[INFO ][status] Kibana is now available (was degraded)Open this url on your local web browser to see if you can access the web interface
http://<ipaddressofyouraspberry>:5601
replace the ip with the ip of your raspberry (the one you connect using ssh)
You should see a login screen, if not wait a little and refresh the page.
Add the Suricata extension to Kibana
Log with the suricata user and the password you provides from previous step
On the Home page, click on Add Integration and search for suricata, and add the integration
Or
Open this link: http:// <ipaddressofyouraspberry>:5601/app/fleet/integrations/suricata-2.6.0/add-integration
On this page, you will need to :
- Change the Suricata log eve path from /var/log/suricata/eve.json to /mnt/usb1/suricata_logs/eve.json.
- Uncheck the “Collect system logs and metrics” option
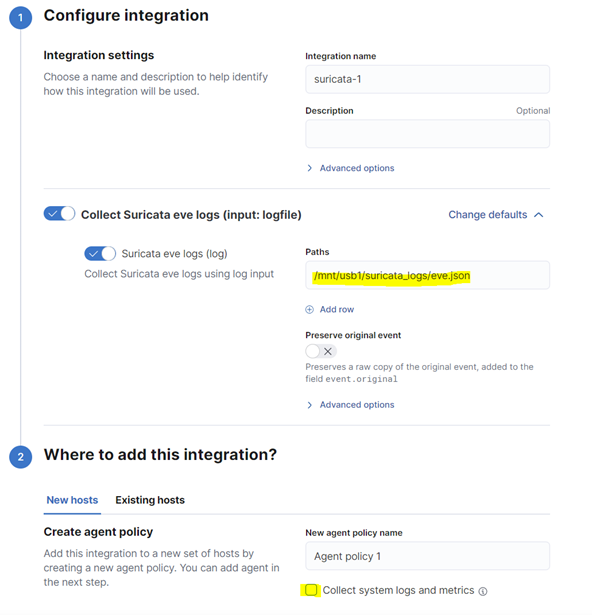
Click on “Save and Continue”
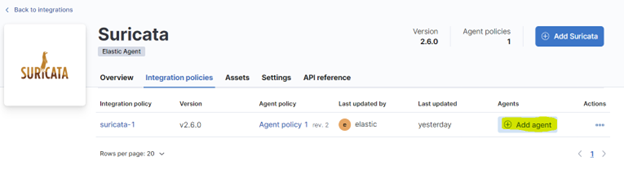
Check if the system integration has been added, if yes remove it
Wait for the deployment and click on “Add agent Now” (you can also find this option later by opening the Integration policies tab of the Suricata extension)
Install elastic agent on your Raspberry
Elastic Agent is a software agent that enables centralized management of various types of agents in a distributed environment. It is a part of the Elastic Stack, which is a set of open-source tools for data management and analysis, including Elasticsearch, Kibana, and Logstash.
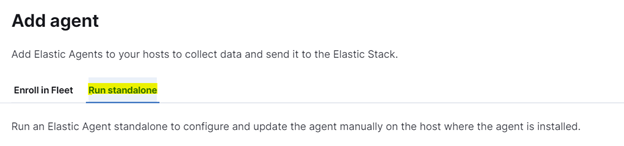
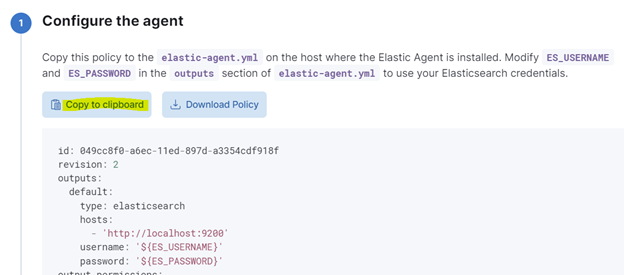
Follow the proposed step :
- Step 1 Configure the agent
Click on “Copy to clipboard” for later use
- Step 2 Install Elastic Agent on your host
Copy the proposed command but replace the package by the arm64 version
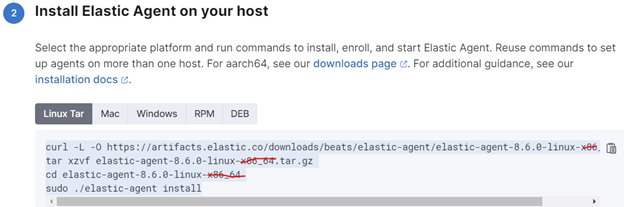
Install elastic agent
curl -L -O https://artifacts.elastic.co/downloads/beats/elastic-agent/elastic-agent-8.6.0-linux-arm64.tar.gz
tar xzvf elastic-agent-8.6.0-linux-arm64.tar.gz
cd elastic-agent-8.6.0-linux-arm64
sudo ./elastic-agent install --path.logs /mnt/usb1/elastic-agent/
Choose Yes to install and No to enroll into Fleet
Move the elastic-agent.yml config to .old
sudo mv /opt/Elastic/Agent/elastic-agent.yml /opt/Elastic/Agent/elastic-agent.yml.old
Configure Elastic-agent
After the installation, edit the elastic-agent.yml configuration file
sudo nano /opt/Elastic/Agent/elastic-agent.ymlPaste the content copied in the previous step for elastic-agent.yml and replace username and password with elastic and the password you set previously:
username: 'elastic'
password: '<yourelasticpassword>'
Restart the elastic-agent :
sudo service elastic-agent restartTest your Home IDS
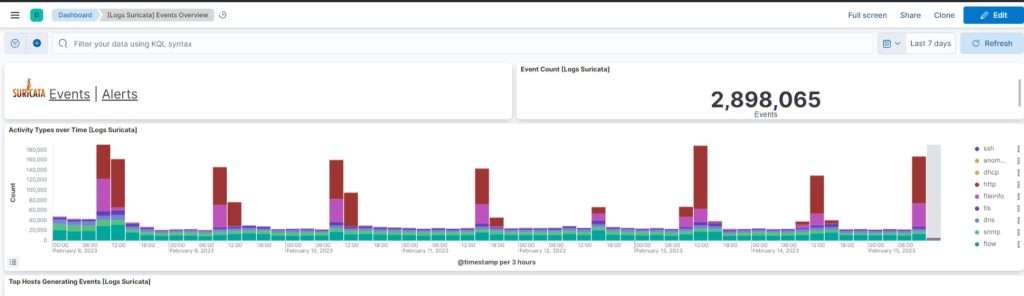
Access your dashboards in Kibana
Go to your local web browser, and navigate to :
http://<ipaddressofyouraspberry>:5601
Open the [Logs Suricata] Events Overview or [Logs Suricata] Alert Overview Dashboard and query
Configure port mirroring on your switch
Suricata IDS runs on the Raspberry Pi which is connected to a port of your switch.
The equipment to be monitored is connected to other ports of the switch. (computer, wifi access point, etc…)
In order to be able to analyze the traffic of all devices connected to this switch, the Raspberry Pi port must be configured as a monitor port and other ports a mirrored port in both inbound and outbound directions.
Conclusion
For those seeking a robust and dependable home security solution, the Raspberry Pi4 8G Arm64 Home IDS is a great option. With its optimized configuration of Suricata, ElasticSearch, and Kibana for ARM64 and the 8GB of RAM it offers, it provides a cost-effective and straightforward setup, making it an ideal choice for home or business security needs.
Follow me or contact me on Linkedin